U Mobile FY25 Financial Losses Widen to RM1.62 Billion
U Mobile FY25 Financial Losses Widen to RM1.62 Billion as 5G Costs Rise
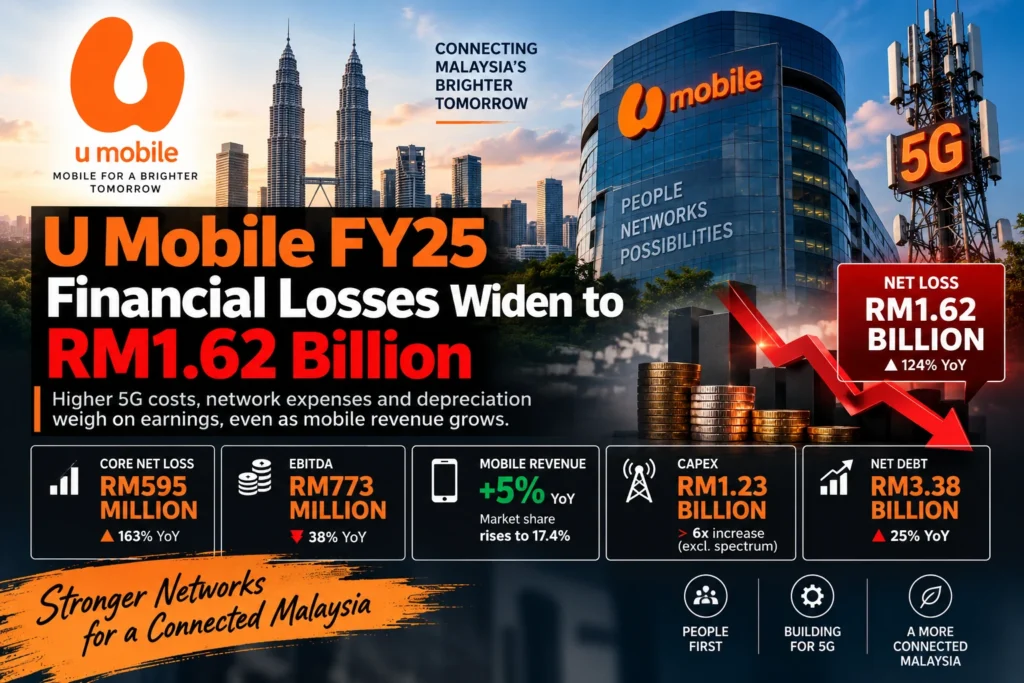
U Mobile’s FY25 financial losses widened sharply as the Malaysian telecom operator accelerated investment in its 5G network, with higher network expenses, depreciation and financing costs weighing on earnings. According to a CIMB Securities analysis reported by New Straits Times, U Mobile’s headline net loss increased 124% year-on-year to RM1.62 billion in financial year 2025.
The figures show the financial pressure created by the company’s rapid network expansion. At the same time, U Mobile continued to increase its presence in Malaysia’s mobile market, with mobile-service revenue rising 5% and its mobile revenue market share reaching 17.4%.
The combination of rising losses and stronger service-market performance makes FY25 an important year for U Mobile. The company is spending heavily to establish its own 5G infrastructure while trying to convert that investment into sustainable revenue growth.
U Mobile’s FY25 Net Loss Climbs to RM1.62 Billion
The most striking figure from the FY25 financial review is the increase in U Mobile’s headline net loss.
CIMB Securities said the loss widened by 124% year-on-year to RM1.62 billion. A major contributor was accelerated depreciation, which reached RM1.03 billion, compared with RM489 million in FY24.
Accelerated depreciation can significantly affect reported profit because investments in assets are recognised as expenses over time. In U Mobile’s case, the higher charge reflects the company’s rapidly changing asset base as it invests in network infrastructure and prepares for a larger role in Malaysia’s 5G market.
The company’s core net loss also deteriorated. CIMB Securities estimated that U Mobile’s core net loss widened 163% to RM595 million in FY25.
When interest costs associated with shareholders’ advances and redeemable convertible preference shares are excluded, the core net loss was still substantially higher at RM383 million, compared with just RM19 million a year earlier.
EBITDA Fell 38% as Costs Increased
U Mobile’s earnings before interest, tax, depreciation and amortisation, or EBITDA, declined 38% year-on-year to RM773 million.
Its EBITDA margin fell by 15.2 percentage points to 22.2%. CIMB Securities attributed the pressure to higher network and device costs and possible one-off charges.
The decline in EBITDA is important because it shows that the pressure on U Mobile’s results was not caused only by accounting depreciation. The company also faced higher operating costs while expanding its network and supporting its growing customer and product base.
At the same time, normalised depreciation and amortisation fell 10% to RM935 million. CIMB Securities said this reflected a lower fixed-asset base following cumulative accelerated depreciation of about RM1.5 billion in FY2024 and FY2025.
Net interest costs also increased, although at a much slower rate, rising 2% year-on-year to RM432 million.
U Mobile’s Mobile Revenue Continued to Grow
Despite the weaker bottom line, U Mobile’s core mobile-services business continued to gain market share.
Mobile-service revenue increased 5% year-on-year in FY25. That compares with a 1% decline at CelcomDigi and broadly flat mobile-service revenue at Maxis, according to the CIMB Securities analysis.
U Mobile’s mobile revenue market share consequently increased by 0.8 percentage point to 17.4%.
The change continues a long-term upward trend. U Mobile’s mobile revenue share was only around 2.1% in FY12, meaning the company has significantly expanded its commercial position over the years.
CIMB Securities said U Mobile’s stronger top-line performance may have been helped by its expansion in Sabah and Sarawak, where the company has invested in network coverage and distribution.
Sales of goods were another growth area. They rose 41% year-on-year after increasing 38% in FY24. The research analysis said the increase pointed to stronger traction for device-bundled postpaid plans and 5G broadband offerings.
5G Rollout Drives a Major Increase in Capital Spending
The financial strain becomes clearer when U Mobile’s capital expenditure is examined.
Capitalised capital expenditure excluding spectrum increased more than sixfold to RM1.23 billion in FY2025. The jump was driven by the company’s rollout of its own 5G network, which began in mid-2025.
This investment is central to U Mobile’s position in Malaysia’s evolving 5G market. The company was selected by Malaysia’s communications regulator in 2024 to establish the country’s second 5G network, moving the market toward a dual-network structure.
U Mobile has since invested heavily in infrastructure. Independent reporting on the rollout indicates that the company made rapid progress in expanding its own 5G network during 2025 and 2026. The scale of that investment helps explain why depreciation, financing needs and capital expenditure have increased at the same time.
For readers interested in broader financial concepts such as capital investment, debt and cash-flow management, Newsgrow.club’s guide to the fundamentals of finance provides useful background.
Debt Increased as U Mobile Funded the Network Expansion
Higher capital expenditure requires financing, and U Mobile’s balance sheet reflected that pressure in FY25.
CIMB Securities said the company funded the increased spending through higher term loans, vendor financing and short-term trade credit. Term loans increased by RM338 million year-on-year, while vendor financing increased by RM493 million.
Excluding shareholders’ advances and redeemable convertible preference shares, U Mobile’s net debt rose 25% to RM3.38 billion at the end of FY25.
The increase in leverage becomes more significant when measured against falling EBITDA. U Mobile’s net debt-to-EBITDA ratio reached 4.4 times, compared with 2.3 times for CelcomDigi and 1.9 times for Maxis in the comparison cited by CIMB Securities.
That does not automatically indicate a financial crisis, but it does show that U Mobile entered a more capital-intensive phase of its development. The company must now generate enough additional cash earnings from its network and customer base to support the debt associated with the rollout.
Free Cash Flow Turned Negative
Cash generation also weakened during the year.
U Mobile’s free cash flow to equity, or FCFE, moved to a negative RM251 million, compared with positive RM123 million previously.
The calculation included about RM819 million in cash-flow capital expenditure and RM103 million in net repayments of vendor financing.
Negative free cash flow is not unusual during a major infrastructure build-out. Telecom operators often spend heavily before the financial benefits of a new network fully emerge. The key issue is whether increased network utilisation, subscriber growth and service revenue can eventually offset the initial investment burden.
Why U Mobile’s Revenue Growth Matters
U Mobile’s FY25 results therefore contain two very different messages.
On one side, the company’s losses, leverage and cash-flow position deteriorated sharply. On the other, its mobile-service revenue and market share continued to improve.
That combination suggests U Mobile is in an investment-heavy transition period rather than simply experiencing weaker demand. The company is spending to build infrastructure while trying to strengthen its position against established operators.
The eventual payoff from that investment will depend on several factors, including customer adoption, network utilisation, pricing, operating costs and the company’s ability to turn greater coverage into recurring revenue.
Shareholder Structure Changed in 2026
U Mobile’s ownership structure also changed significantly during the period under review.
According to CIMB Securities, Mawar Setia Sdn Bhd became U Mobile’s largest shareholder with a 50.2% stake on March 17, 2026, after completing a share purchase agreement involving Singapore Technologies Telemedia, or ST Telemedia.
Following the transaction, ST Telemedia’s stake fell to 20.7%.
The change is notable because U Mobile is entering a strategically important phase in which capital requirements are high and the company is expanding its role in Malaysia’s telecom infrastructure market.
U Mobile’s Position in Malaysia’s 5G Market
U Mobile’s financial results need to be viewed within the larger transformation of Malaysia’s 5G industry.
The country has been moving from a single wholesale-network approach toward a two-network structure. U Mobile’s selection as the second 5G network provider gave the company an opportunity to build its own infrastructure rather than relying solely on the earlier national wholesale arrangement.
The transition creates an important commercial opportunity, but it also requires substantial investment. U Mobile’s FY25 financial results show the cost of that transition in concrete terms: more than RM1.2 billion in capitalised network expenditure, rising depreciation, increased financing requirements and weaker free cash flow.
At the same time, the company’s ability to grow mobile-service revenue and increase its market share suggests there is a developing revenue base that could support the network investment over time.
What to Watch After FY25
The next phase of U Mobile’s financial story will depend less on the initial network build and more on how effectively the company monetises it.
Investors, lenders and industry observers will likely focus on the pace of service-revenue growth, EBITDA recovery, capital expenditure requirements, debt levels and the eventual impact of the new network on customer acquisition and retention.
Another important area will be the balance between network investment and financial discipline. Continued expansion can strengthen coverage and service quality, but excessive capital intensity could keep pressure on cash generation if revenue growth does not accelerate sufficiently.
For broader coverage of financial concepts and business developments, readers can explore Newsgrow.club’s Finances section and related explainers such as how EMI and structured payments work.
Key U Mobile FY25 Financial Figures
| Metric | FY25 | Change / Context |
|---|---|---|
| Headline net loss | RM1.62 billion | Up 124% YoY |
| Core net loss | RM595 million | Up 163% YoY |
| Core net loss excluding SHA and RCPS interest costs | RM383 million | RM19 million in FY24 |
| EBITDA | RM773 million | Down 38% YoY |
| EBITDA margin | 22.2% | Down 15.2 percentage points |
| Accelerated depreciation | RM1.03 billion | RM489 million in FY24 |
| Normalised depreciation and amortisation | RM935 million | Down 10% YoY |
| Net interest costs | RM432 million | Up 2% YoY |
| Mobile-service revenue | Growth of 5% | Outperformed key competitors in the comparison |
| Mobile revenue market share | 17.4% | Up 0.8 percentage point |
| Capitalised capex excluding spectrum | RM1.23 billion | More than six times FY24 |
| Net debt excluding SHA and RCPS | RM3.38 billion | Up 25% YoY |
| Net debt-to-EBITDA | 4.4x | Higher than the peer figures cited by CIMB Securities |
| FCFE | Negative RM251 million | Versus positive RM123 million previously |
Frequently Asked Questions
Why did U Mobile’s FY25 financial losses increase?
The main pressures identified by CIMB Securities were higher network and device costs, accelerated depreciation associated with the broadband and 5G rollout, higher financing requirements and weaker EBITDA.
How much was U Mobile’s FY25 net loss?
U Mobile’s headline net loss was reported at RM1.62 billion, an increase of 124% from the previous year.
What was U Mobile’s core net loss in FY25?
CIMB Securities estimated U Mobile’s core net loss at RM595 million, up 163% year-on-year. Excluding interest costs related to shareholders’ advances and redeemable convertible preference shares, the figure was RM383 million.
Did U Mobile’s revenue increase in FY25?
Yes. Mobile-service revenue increased 5% year-on-year, while mobile revenue market share rose 0.8 percentage point to 17.4%.
How much did U Mobile spend on 5G-related capital expenditure?
Capitalised capital expenditure excluding spectrum rose more than sixfold to RM1.23 billion in FY2025, with the increase linked to the company’s 5G network rollout.
Did U Mobile’s debt increase?
Yes. CIMB Securities said net debt excluding shareholders’ advances and redeemable convertible preference shares increased 25% year-on-year to RM3.38 billion at the end of FY25.
Conclusion
U Mobile’s FY25 financial results show the cost of building a major telecommunications network while trying to expand market share. The company’s headline net loss rose to RM1.62 billion, core losses widened sharply and leverage increased as 5G investment accelerated.
Yet the figures also show a business gaining commercial momentum. Mobile-service revenue grew 5%, market share reached 17.4%, and sales of goods increased 41%.
The central question for U Mobile now is whether those revenue gains can eventually catch up with the cost of its network expansion. FY25 was dominated by investment and higher costs; the coming periods will provide a clearer test of how effectively the new 5G infrastructure can translate into stronger earnings and cash generation.
Sources and Further Reading
- New Straits Times — U Mobile sees FY25 losses widen as 5G costs bite, gains ground in services
- DagangNews — CIMB Securities analysis of U Mobile’s FY25 performance
- MalaysianWireless — U Mobile’s 5G network expansion and 2026 network-performance context
Financial disclaimer: This article is for news and informational purposes only. It is not investment advice, a recommendation to buy or sell securities, or an assessment of U Mobile’s future valuation. Readers should review official financial information and seek qualified professional advice before making investment decisions.